


By clicking to read something with a title of ‘How Analytics Can Get You More Leads’, you’re probably in one of two categories:
- You understand the importance of data but just need some guidance on how to get more useful information out of Google Analytics (GA)
- You feel like you’ve tried everything to encourage more prospects to enquire through your website and you feel like not much of it is working
If either of the above sounds like you then read on, my marketing friend!
This post will help you to understand Google Analytics better so that you can derive meaningful data to empower you to make informed business decisions, specifically in relation to marketing.
TL;DR (Too long; didn’t read)
- GA can measure the performance of your various marketing strategies
- Use it to set benchmarks when planning new marketing strategies
- You can track specific enquiries/leads with it
- Divide no. of leads by no. of sessions to calculate your website conversion rate
- Contact Ryan directly for more help with data because he loves it (weirdo)
Quick intro…
What Is Google Analytics?
You probably know what Google Analytics is otherwise why would you have clicked to read this article?!
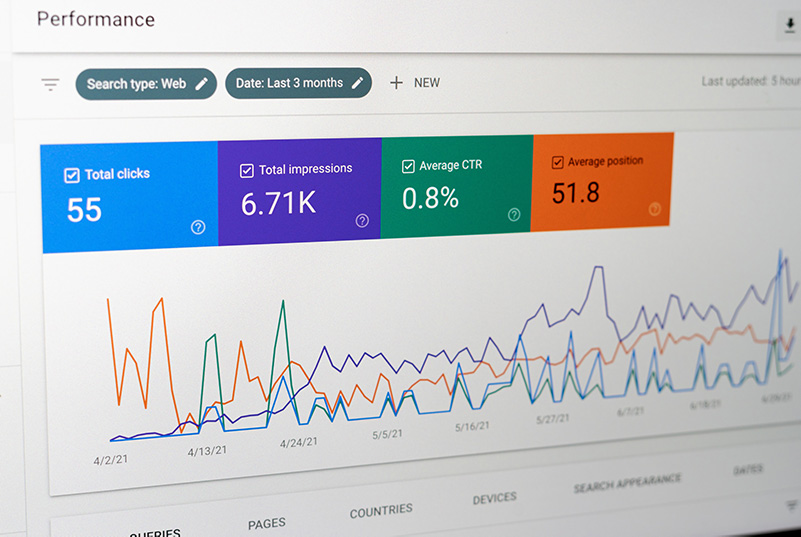
Anyway, it’s a free platform that, when plugged into your website, collects loads of data on how your website visitors interact with your site.
If you don’t know what you’re looking at/for, Google Analytics can seem a little overwhelming.
You can access a lot of data and manipulate it in many ways with reports, filters and goals but for the sake of this article, I’m going to assume you know very little.
With this in mind, here’s an overview of the main areas…
Audience
Unsurprisingly, the reports found under the ‘audience’ tab will tell you all about your website visitors, including:
- How many people visited your website
- How long do they spend on your website
- Their demographics (age, gender, location, language etc.)
- What device or browsers they use
Acquisition
These reports are all about how your visitors found and ultimately got to your website e.g.
- What they searched for in Google (or another search engine ?)
- Which social media platform
- Which 3rd party web page they clicked a link from
- The keyword search that triggered one of your paid search ads
Behaviour
This section is devoted to the content on your website and can provide you with very useful information, such as:
- Which pages on your website are viewed the most
- Which blog posts are viewed the most
- What people search for on your website
- How people navigate through your website
Conversions
A ‘website conversion’ will typically be a new business enquiry. Setting these up requires a little work (covered later in this post) but they will perhaps provide the most useful information such as:
- On which pages your conversions occur
- What time of day or day of the week you’re most likely to win a conversion
- Which source of traffic generates the most conversions
OK, so now you’re a little clearer on what data can be found where but how does all of this apply to the real world of marketing?
You’re likely to look at this data in order to measure your digital marketing efforts or are planning a new marketing strategy.
How Google Analytics Can Help You Market Your Business
Measuring Your Marketing
There are a vast amount of ways to market your services to potential clients. But what are the most effective methods for your business?
The answer always lies in the data. The key to any successful marketing is to test and measure.
I hear far too often from marketers who have ‘tried AdWords’ or ‘don’t think Facebook works for my business’ and it’s usually based on absolutely zero fact because people have a go at something, don’t get immediate results (they think) and quit.
In addition, it’s likely they didn’t even set any SMART goals for their new strategy either so how on earth can they know what success looks like?!
And, I’m not talking about crap like ‘I’m going to post some videos to LinkedIn to get some new business enquiries’!
How many enquiries are you going to get?
Within what timeframe are you going to achieve this?
How many videos are you going to post?
When will you post them?
Alright, you get the idea and I’m going to give you the benefit of doubt though and assume that you’re different and that you are clear on what you want to achieve from your marketing strategy.
Here are a couple of typical questions you may have…
How many people have visited my website from (social media platform) between (start-date) and (end-date)?
Before we continue, it’s important to understand the difference between ‘Sessions’ and ‘Users’.
A session is what’s commonly referred to as a ‘hit’ on your website. Sessions could be started by one person on multiple occasions.
A ‘User’ is a session started by a unique device or person. This is tracked by IP address so if a person was to visit your website from their work PC and then again on their laptop at home, this would be recorded as 2 sessions from 2 users. However, if someone visits your website from their laptop at home in the morning and again in the afternoon, this is 2 sessions by 1 user.
So, to get an answer to our question, we should head to the ‘Acquisition’ area of Google Analytics and the ‘Overview’ report.
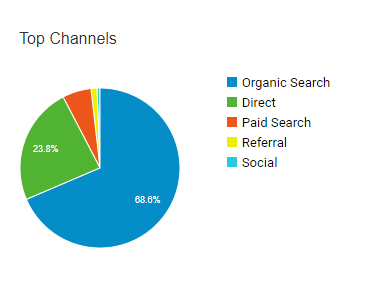
This shows us where all of our website traffic came from, typically grouped into the following categories:
Organic Search
Visits to your website that originated from a search engine e.g. Google but not from a paid ad
Social
These visitors arrived by clicking a link to your website from any of the social media platforms e.g. Facebook, LinkedIn, Twitter etc.
Referral
A referral occurs when someone clicks a link to your website from any other website that isn’t a social media platform or search engine
As you’ve probably guessed, these people found your website by clicking a link from an email
Direct
Commonly misunderstood, ‘Direct’ traffic is that which Google Analytics couldn’t track the source e.g. someone manually types in your URL or clicks a bookmark saved in their browser
Paid Search
These are visits to your website which came from someone clicking a paid advert within a search engine e.g. Google AdWords
So, assuming we have some traffic that came from a social media platform, we can click on ‘Social’ to see a further breakdown of which platforms sent people to our website and then click on the particular platform we want to investigate further.
Now, all we need to do is set the dates for the period of time that you want to review.
To do that, simply click on the dates near the top-right corner and select the correct start and end dates.
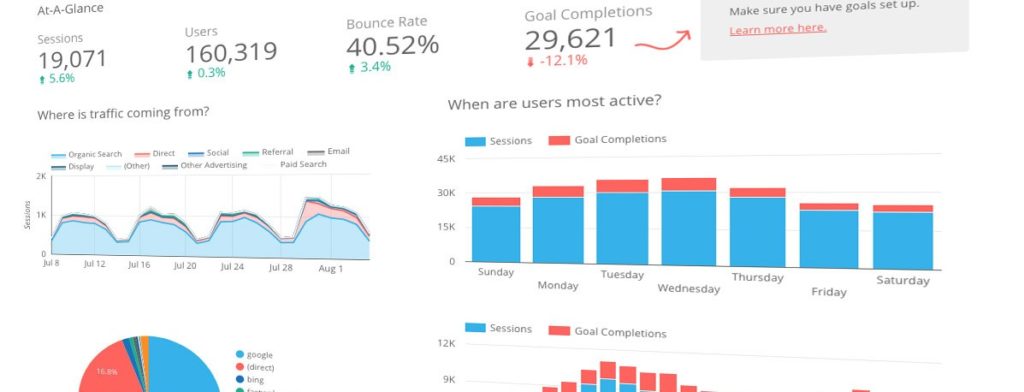
Now we’re on the right report with the correct date range, we can gather a huge amount of useful information including:
- How many sessions occurred and from how many users
- At what points during the date range did the visits happen, was it consistent or did it spike at specific times?
- What percentage of people left the site immediately, without taking any action e.g. clicking a link?
- On average, how long did people spend on the site once they had arrived?
The last 2 points above are particularly useful for gauging the quality of the traffic from the particular social media platform because while it’s great to have loads of traffic, it’s pretty pointless if that traffic has no interest in your services.
Which Websites Send The Most People To My Website?
When someone clicks a link on a 3rd party website that sends them to your website, this is called a ‘referral’.
There are often hidden gems within the websites that are referring traffic to you which can be explored to drive even more people to your website.
Again, we’re going to head over to the Acquisition Overview report but this time, click on ‘Referral’ which will show us a list of all the external web pages which have generated a visit to our website.
A quick word on referral spam…
When you check out the websites which have linked to yours, you are likely to see some strange URLs e.g. buttons-for-website.com or best-seo-solution.com.
These are typical referral spammers.
Google Analytics referral spam is basically fake or nonexistent website hits which have been created for spammy reasons.
Don’t worry though, this happens to almost every analytics account I’ve ever seen and is not part of a malicious attack on you/your website, it’s purely spam.
You can easily tell which referrers are spam as they always have 100% bounce rate and 0 average session duration so be sure to ignore these.
There are ways to remove this spam which you can learn more about in Neil Patel’s blog.
OK, so by ignoring/removing the spam URLs, we will be left with all of the URLs which have sent traffic to our website in the given timeframe.
Depending on how much traffic your website gets, this list could be quite substantial but you should be able to compare which websites are sending both the highest volume and the highest quality traffic.
Planning New Marketing Strategies
Earlier, we touched on setting SMART goals for your marketing and in order to effectively do that, we will need some existing data to get a clear understanding of where we are right now in order to effectively plan for improvement.
Enter benchmarking.
Benchmarking is the process of identifying current performance and using it to measure against future performance.
If we don’t do this, how will we know if the future results we get are better than what we were getting previously?
Let’s say, for example, that you want to attract and win more new clients from your website.
Before we begin to plan how we’re going to do that, we must know more about the existing performance in relation to new business enquiries from the website.
How Many New Business Enquiries Does My Website Generate?
You could review your CRM for a given period to see how many new enquiries came in but unless you have taken the time to set this up, it’s unlikely you will be able to differentiate the source of these enquiries.
With just a tiny amount of work, we can easily get Google Analytics to present this data by using ‘Goals’.
I couldn’t resist, I’m a Newcastle fan!
Near the bottom-left of the Google Analytics screen, click on the ‘Admin’ or cog icon and in the ‘View’ column (far right), click on ‘Goals’.
All we need to do is create a goal which is triggered each time someone completes the enquiry form on your website.
There are other ways in which someone may engage with your website to make an enquiry but covering all of them is beyond the scope of this article, for more info, contact me directly.
Assuming you have a ‘Thank You Page’ set-up which your users are redirected to after submitting a form, we just need to tell Google Analytics to track the visits to that page and list them as a conversion.
- Click ‘New Goal’
- Click ‘Custom’ and then ‘Continue’
- Give your goal a name e.g. ‘Contact Form Submissions’
- Choose ‘Destination’ as the type and click ‘Continue’
- Paste in the full URL of your website thank you page in the empty box
- Click ‘Save’
That’s it! Now you will be able to easily see how many times your contact form is completed.
You could very easily set multiple goals up for any other forms you have on your website, you just need to ensure they each have a unique thank you page URL.
These new goals will only start tracking from when you set them up so you will need to leave some time before there is any data available.
To review the number of conversions that occur on your website, you just need to go to, believe it or not…‘Conversions’, ‘Goals’ and then ‘Overview’.
From this report, you can easily see a breakdown of the performance of each of the goals you have set up.
Website Conversion Rate
Knowing the number of leads/enquiries you get from your website is great but on its own, it’s not enough because there is no context.
Let’s say our website is generating 100 new enquiries each month, depending on the size of your company, you’re likely to be pretty pleased with that.
But what if our website receives 100,000 visits every month?
It would appear that actually, our website could be working harder to convert more website visitors into leads.
This is why we need to know our website conversion rate.
Fortunately, once we have our goals set up (above), calculating the conversion rate is really easy, here’s the formula:
(Number of conversions / Number of sessions) x 100 = website conversion rate
Using the example above, we can use the formula to give us the website conversion rate as follows:
Number of conversions = 100
Number of sessions = 100,000
100 / 100,000 = 0.001
0.001 x 100 = 0.1
Our website conversion rate is just 0.1%!
Suddenly, it’s apparent that either our website is severely underperforming or the traffic we’re getting is of very low quality or a combination of both. This would need further investigation.
Now we know that there is a huge opportunity to attain more leads by improving our website.
The above formula could be used with all of our goals to see an overall website conversion rate or with 1 goal to see the conversion rate of a specific form on your website.
Now that we know these base stats for how our website is currently performing, we can set much better SMART goals for our new marketing strategies.
Summary
I’ll admit this article went on much more than I had planned but that’s because I’m a self-confessed data nerd!
So, if you’re still reading, well done!
There’s a wealth of useful information you can gather from reviewing and understanding the performance data on your website and if you’d like to know more or would simply like to have a Google Analytics Consultant on your side of the table, just let me know; [email protected].
If you get value from my posts and would like to be notified whenever I publish new content, just pop your name and email address in the box below.